Understanding Shock Response Spectra (SRS): A Practical Guide for Vibration Test Engineers
Shock Response Spectrum (SRS) analysisis a method used to determine how a structure or component responds to a transient shock or impact. The term Shock Response Spectrum typically refers to a single spectrum or plot, while Shock Response Spectra is the plural form used when referring to multiple spectra or plots.
SRS is widely used in many industries. Data Physics analyzers and controllers make the process of measuring shock response spectra and producing transients from a given shock response spectra easy. It is important to understand what an SRS is and how it is used for shock testing.
The shock response spectrum was first conceived by Dr. Maurice Biot in 1932 to characterize earthquakes. It was initially used by Navy in early 1960s as an indicator of mechanical shock severity. Now, SRS is widely used as a design specification tool for impulsive loads characterization such as:
Earthquakes
Drop impact
Launch forces
Stage separation forces
Pyrotechnic events
A common misconception with shock response spectra is that it is a frequency domain signal. In fact, the shock response spectrum is calculated from the peak time domain response of a single degree of freedom system.
An SRS is typically plotted as:
X-axis: Natural frequency (Hz)
Y-axis: Peak response, usually expressed as:
Acceleration (g)
Relative displacement
Relative velocity
Pseudo velocity (commonly used for mechanical shock analysis)
To understand SRS, you must first look at the response of a single degree of freedom (SDOF) system to a transient input. The diagram below shows a single degree of freedom system characterized by a mass supported by a spring and damper system.
The transmissibility between the transient input and the single degree of freedom response is given by the following equation:
The ratio of the spring stiffness to the mass determines the natural frequency of the SDOF system. The transmissibility of the input to the response is shown in the graph below. The resonance results in amplification of the response signal near the resonance frequency and attenuation of the response above the natural frequency. The damping factor influences the amount of amplification at resonance.
The damping factor can also be expressed as a percentage of critical damping, or Q, where:
The shock response spectrum is computed by creating a series of SDOF filters that are logarithmically spaced at nth octave frequencies. Each filter will have the same damping factor.
The time-domain response of a single-degree-of-freedom (SDOF) system is computed using SDOF filters, and the peak response is then used to generate the Shock Response Spectrum (SRS). Several types of peak response measurements can be used in SRS analysis.
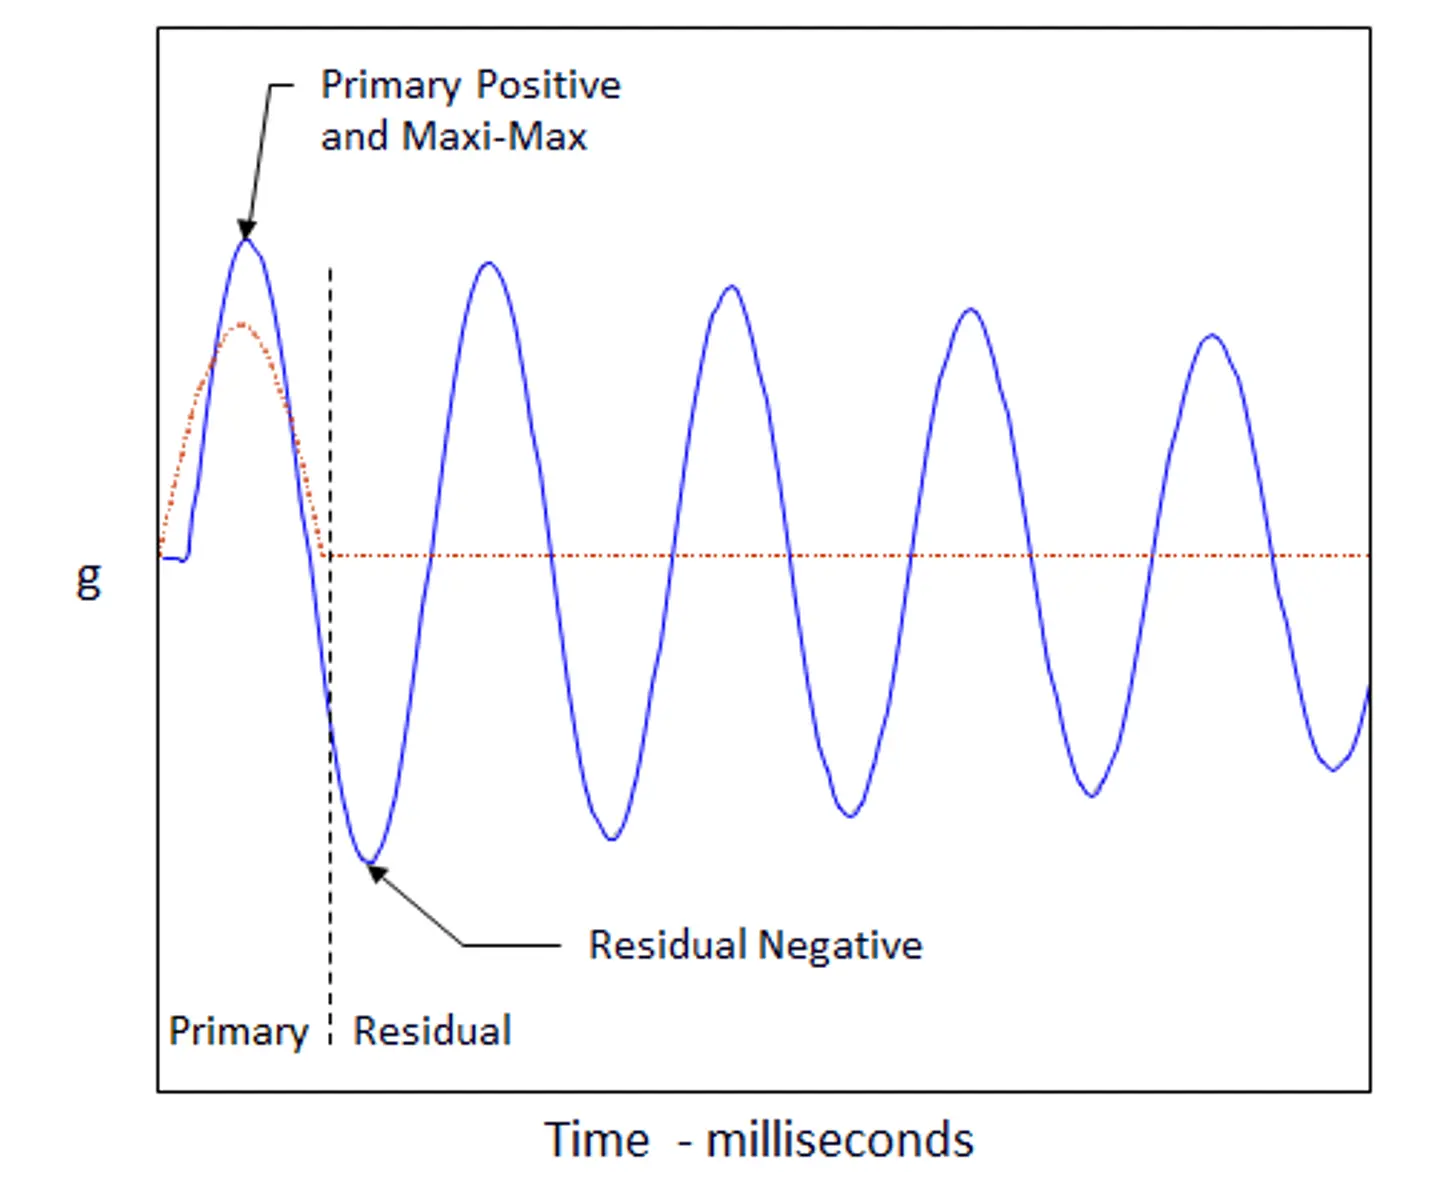
The SDOF response time history is divided into two sections. The portion of the response that occurs during the excitation is referred to as the Primary Response. The portion that occurs after the excitation has ended is referred to as the Residual Response.
The highest absolute values of the positive and negative responses within the Primary and Residual portions of the SDOF response are used to calculate the different types of SRS measurements. The overall maximum absolute value of the SDOF response is referred to as the Maxi-max.
SRS Types Include:
Maxi-Max – The overall maximum absolute value of the SDOF response, regardless of when it occurs or whether it is positive or negative
Primary Positive – The maximum positive response that occurs during the excitation portion of the shock
Primary Negative – The maximum negative response that occurs during the excitation portion of the shock
Residual Positive – The maximum positive response that occurs after the excitation has ended
Residual Negative – The maximum negative response that occurs after the excitation has ended
These are illustrated in the following graph.
The Shock Response Spectrum is generated by plotting the peak response of a series of SDOF systems against the natural frequency of each system. The analysis is typically performed over a logarithmic frequency axis using nth octave frequency spacing. This process is illustrated in the figure below.
The damping values used in an SRS measurement are constant for all frequencies. For pyrotechnic events, a 5% critical damping is commonly used, while 2% critical damping is typically used for earthquake testing.
The highest damage potential due to a shock input is at the natural frequencies of the test article. The SDOF model is used to predict the response of a product at its natural frequency to a given shock input. Since the natural frequency can occur anywhere within the test frequency range, the SRS computes the peak SDOF response as a function of frequency, typically using nth octave frequency spacing.
The graphs below show a shock pulse and its shock response spectra. Notice that the peak amplitude of the shock pulse is approximately 17 g, while the peak SRS response is 40 g. This higher amplitude is typical of SRS and is caused by the amplification that occurs due to the resonance.
As the fundamental goal of an SRS measurement is to capture the absolute maximum peak response, the measurement system must be capable of accurately recording high amplitude signals (high g levels) at a sufficiently high sampling rate. The sampling rate is typically 10 times the maximum analysis bandwidth.
Explore the power of the SignalCalc 900 Series software – with no hardware required. Run simulated tests, review results, and generate reports exactly as you would in a live environment.
Data Acquisition • Signal Analysis • Vibration Control